Measure, monitor and manage the consumption and production of water, gas, electricity and heating oil in your building — all within the same interface as your Snugr heating control system. What you measure, you can improve.
Without data, it’s impossible to know where your energy is going — or to prove your savings. The Snugr smart metering box collects your consumption data, turns it into clear graphs and budget estimates, and alerts you as soon as consumption gets out of hand.
Your consumption, your energy production and your temperatures, all on a single dashboard
The Snugr device collects data from various meters and sensors in your building:
Why choose Snugr smart-metering?
A single interface: Your consumption and your heating in one place, accessible from a web browser. No software to install.
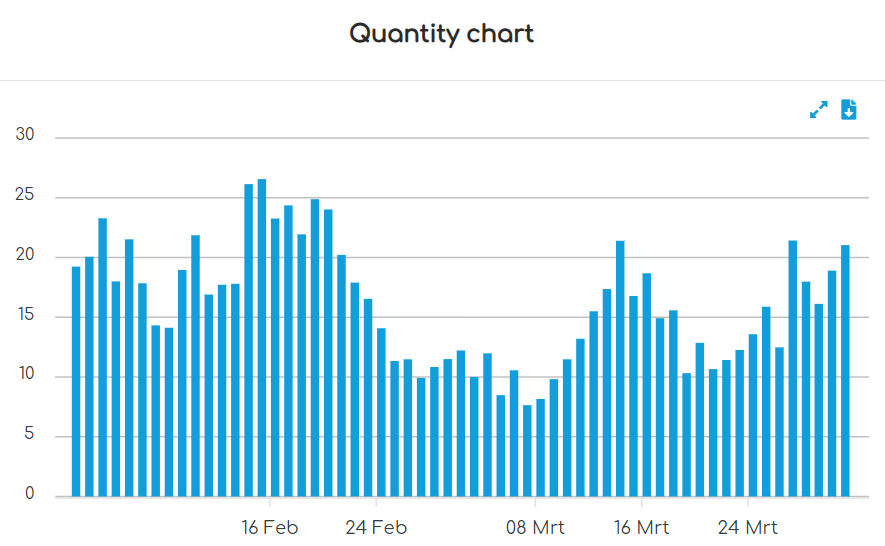
Clear graphs: View consumption by the hour, day or month.
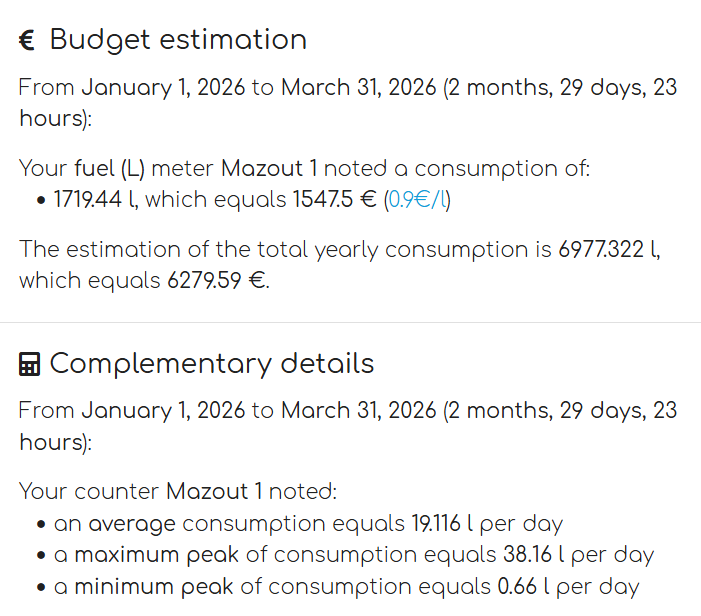
Budget control: Set your tariffs (€/kWh, €/litre…) and get a cost estimate for any period.
Automatic alerts Get notified as soon as a consumption exceeds (or falls below) a threshold you set.
No heavy works The unit communicates with the optimiser over radio waves, with no network cabling required.
Exportable data CSV export of values and PNG/SVG export of graphs for your reports.
From your meters to your decisions
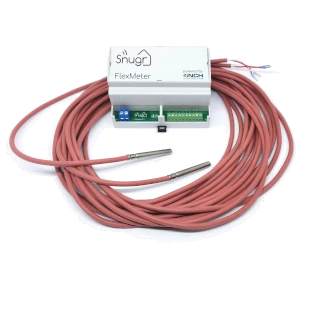
The unit accepts up to 8 pulse meters (water, gas, electricity, heating oil…) and 4 wired temperature probes, for instance to measure the flow and return temperatures of a heating circuit.
Data is sent by radio to the Snugr gateway — no new network cabling to install. Simple 230VAC power supply.
You consult everything in the interface: graphs, totals, averages, minimum/maximum and budget estimates over the period of your choice — giving you objective data to monitor or re-invoice energy consumption when renting out your buildings
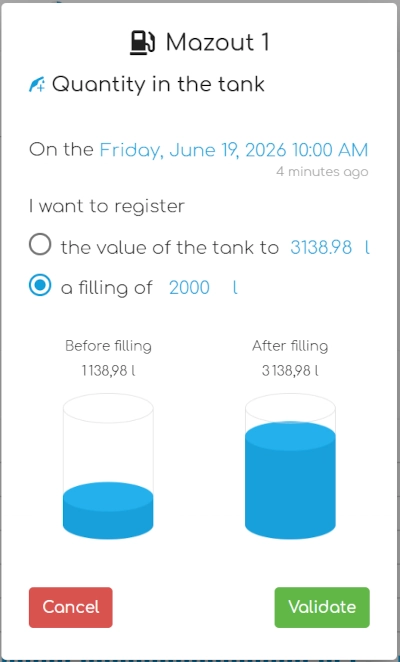
Heating-oil specifics: Record your tank refills (partial or full) on any given date. The system automatically recalculates the remaining capacity — even if you enter the refill afterwards — and alerts you when it's time to refill!
Energy accounting: Useful reports, not just figures
In the interface, for any selected period, you get:
✅Average, total, minimum and maximum consumption (by hour, day or month)
✅Filtering by period to analyse or compare two weeks, two months or two seasons — not just the billing period
✅Budget estimates based on your tariffs (useful for day/night energy bills or for cost re-invoicing)
✅Index corrections on a specific date, if a reading needs to be adjusted
Your data, where you need it
CSV exportof measurements and PNG/SVG export of graphs for your reports and presentations.
Compatibility with the BACnet/IP protocol to forward temperatures and consumption indexes to your existing BMS.
Documented API to retrieve data and automate certain functions.
Designed for building managers
🏛️ Municipalities & public buildings — justify and track consumption, feed reports and UREBA subsidy applications
🏫 Schools & universities — track building by building, detect deviations
🏢 Tertiary sector & property managers — split and invoice (sub-metering)
🏭 Industrial sites — monitor water, gas and electricity by station and by building
The natural complement to your Snugr heating control
Smart-metering is not a standalone tool: it shares the same interface as the Snugr heating control. You act on the heating (valves, schedules) and you measure the effect on consumption — all in one place. It's the complete loop: regulate, measure, adjust, save.
Take back control of your energy consumption and generation
Request your free, no-obligation quote. We’ll help you choose the right meters and configuration for your building.
Frequently asked questions about Snugr smart-metering
What types of consumption and production can I track?
Water, gas, electricity and heating-oil consumption, as well as production (for instance photovoltaic electricity). You can also track the flow and return temperatures of your heating circuits.
How many meters can I connect?
Up to 8 pulse meters and 4 wired temperature probes per unit (2 probes of 2 m included).
Do I need to install any software?
No. Everything is accessible from the Snugr web interface — the same one used for heating control.
Can I estimate my energy budget?
Yes. You set your tariffs (€/kWh, €/litre…) and the interface calculates a cost estimate for the selected period.
How do I manage a heating-oil tank?
You record your refills (partial or full) on a given date; the system automatically corrects the level, even for a refill entered after the fact.
Can I export my data?
Yes: CSV export of values and PNG/SVG export of graphs.
Is it compatible with my BMS?
Yes, via the BACnet/IP protocol, and via a documented API.
Are major works needed?
No. The unit communicates with the optimiser over radio waves; a simple 230VAC power supply is enough, and you only need to connect your pulse meters to this unit.